Primary Population Characteristics
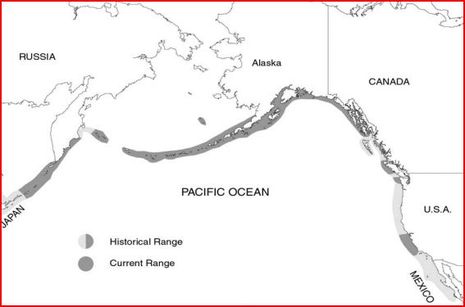 Figure 1:
Historical and Current Population
Figure 1:
Historical and Current Population
The sea otter was once found throughout the coastal regions of the Northern Pacific Ocean. At one time, the populations spanned continuously from northern Japan to central California, however the near extinction as a result of the fur trade caused the population to diminish. As a result, sea otters were only located in small populations in California, Alaska and Russia. Now, they have recovered and occupy about half of their original range, and continue to expand (Bodkin, 2012) as shown in figure 1.
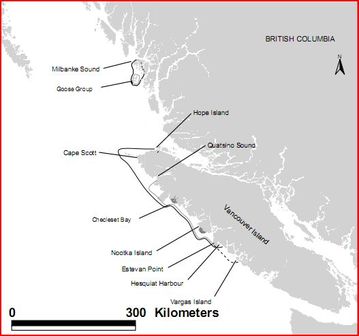 Figure 2: Sea otter population on coast of Vancouver.
Within Canada, sea otters were originally reintroduced to Checleset Bay. Until 1987, otters occupied only Nootka Island and Checleset Bay off of Vancouver Island. By 1992, the otter population had increased, and continuously spanned Vancouver Island, from Estevan Point to Quatsino Sound. Finally, by 2004, sea otters in B.C were found throughout the Vancouver Island coast, and even north of Milbanke Sound (Bodkin, 2012) as shown in figure 2.
Consistent with most mammals, sea otters exhibit the clumped dispersion pattern (Bodkin, 2012). Sea otters will occupy the coastal waters of the Northern Pacific Ocean. They tend to live around 1-2 kilometers from shore, because of the optimal depth required when diving for food. In fact, sea otters will sometimes rest in groups called “rafts,” and hold hands to stay together. The females and their pups will stay on the inside of the raft, while the males stay to the outside.
Sea otters are density dependent, because as the population increases, the amount of food will decrease. In sections of the coastline, the population reached carrying capacity many years ago because of the high density of sea otters (Bodkin, 2012). However this is not true for all coastal areas, as there are many ideal areas for the sea otter to live, in which it has a very small or no population at all. This can be attributed to its lack of migration, but also the fact that the species was reintroduced to Canada relatively recently, and therefore they have not had time to expand to their full geographic range. For this reason, the density of the sea otter population varies greatly along the western coast of Canada.
Age Structure and Genetic Diversity
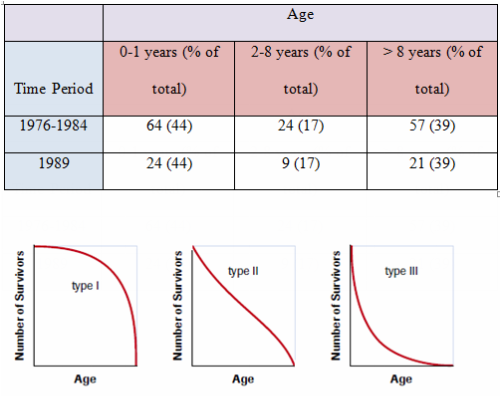 Figure 3 (above) Figure 4 (below)
The sea otter will generally live between 10 and 20 years, and maintain a relatively constant age structure. In a study done in Alaska, it was found that the most common age range was pups (0-1 years of age) as shown in figure 3. This information shows that the sea otter exhibits type 2 survivorship trends (Costa, 2011). This means that throughout their lives, the sea otter has a relatively constant mortality rate. Although this may be true, there is still a large amount of pups that die before they reach the age of 2 years. Although that pattern would suggest a type three survivorship curve, it is not the case because sea otters produce very few offspring, which is very atypical of a type 3 survivorship species.
The genetic diversity of the sea otter population was greatly impacted and reduced as a result of the fur trade. The extirpation of the sea otter from the west coast meant that all of the genetic diversity within that population was wiped out. When a population of sea otters was re-introduced into the environment many decades later, the same genetic diversity did not exist, this is an example of the bottleneck effect (Carter-Edwards, 2011).
The genetic diversity of the sea otter population was greatly impacted and reduced as a result of the fur trade. The extirpation of the sea otter from the west coast meant that all of the genetic diversity within that population was wiped out. When a population of sea otters was re-introduced into the environment many decades later, the same genetic diversity did not exist, this is an example of the bottleneck effect (Carter-Edwards, 2011).
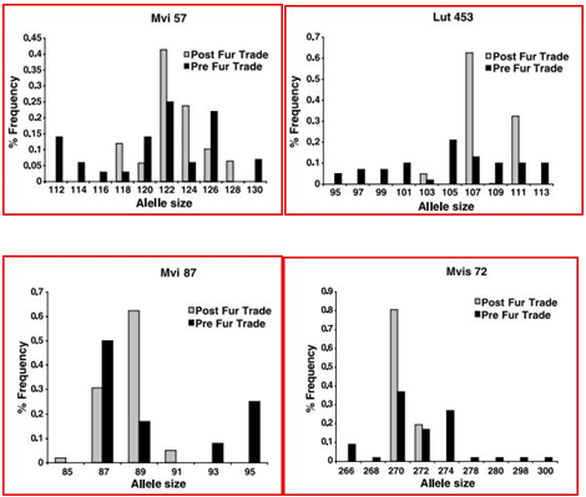
In a 2002 study, scientists were able to compare mitochondrial DNA between current sea otters, and those from the pre-fur trade era (Nichol, 2002). Specifically, they focussed on four microsatellite loci, and compared allele frequencies between the eras. Their results are shown in figure 4:
Overall, their study demonstrated that significant proportion of genetic diversity was lost as a result of the reduction in population size due to the fur trade. The total number of alleles across all loci were found and recorded for pre and post fur trade populations. The results showed that there was a total of 34 separate allele frequencies found in the pre-fur trade population, compared to only an average of 12.8 alleles found in the post fur trade individuals. In fact, there are only 16 observed alleles found amongst all current populations, which is significantly lower than the 34 alleles which were found in the one population of pre fur trade otters (Nichol, 2002).
The loss of genetic diversity was of particular concern when the 89 otters were re-introduced to the Canadian West Coast habitat. With a very small population size, there was a significant risk of loss of genetic diversity. However, the Otter population was able to overcome this obstacle, and now exists in large enough numbers that a loss of genetic diversity is of less concern (Fisheries and Oceans Canada, 2014).
Carrying Capacity and Minimum Viable Population Size
In a survey taken by the government of Canada in 2011, they estimated that the current population was around 3,180 sea otters. They also predicted that the carrying capacity of the population had not been reached, and that sea otters currently occupied only around 25%-33% of their historic range (Fisheries and Oceans Canada, 2011). From this estimation, one can extrapolate a rough estimate of the carrying capacity of the population. Using this information, a rough estimate of the carrying capacity of the British Columbian Coast is around 15,000 individuals.
When the population was extirpated and 89 sea otters were re-introduced in the late 1960’s, there was not initial success. The original population dropped to only about 28 individuals shortly after the population was introduced, however they recovered, and an aerial survey taken in 1977 counted 70 sea otters. The population was able to expand and prosper, and now without further intervention, the otters are back to a safe population. For these reasons, I believe that the minimum population would have to be around 25 individuals because the reintroduced sea otter population was able to survive and prosper when the population had dropped to less than thirty.
In figure 5, the population characteristics are summarized
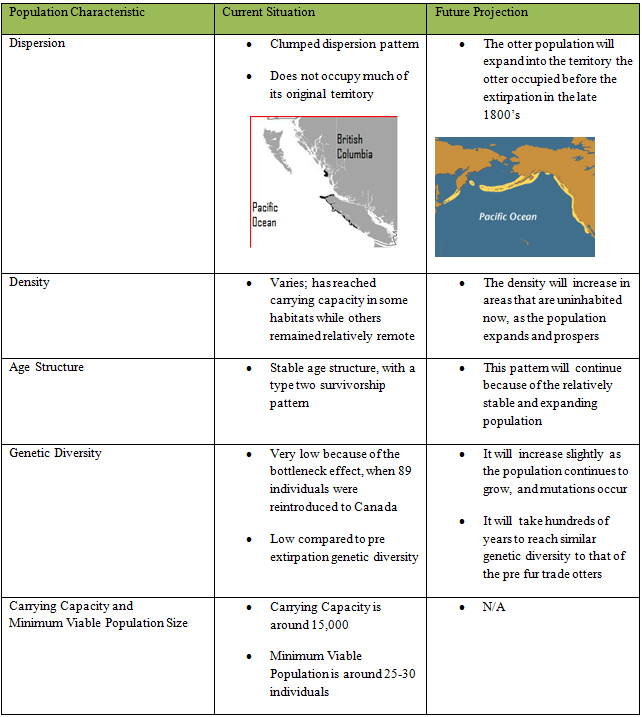
Figure 5: Population Characteristics Summary Chart
